Your business is more complex than your P&L.
Traditional reports show what happened. They rarely explain which customers, products, transactions and operating decisions created the result. Revenue growth doesn’t always mean profit growth.
Fragmented ERP, POS, inventory and finance data make one consistent profitability picture hard to establish.
Conventional reporting aggregates revenue and cost, hiding unprofitable products, customers, orders and channels.
Cost-to-serve, freight, overhead and shared costs are poorly allocated, or invisible at transaction level.
Finance teams spend their time assembling reports instead of investigating root causes and recommending action.
Pricing, discount, purchasing and operational decisions get made without a full view of net profit.
Static reports are slow to expose emerging patterns, and can’t simulate alternative decisions.
Find the profit hidden in your data.
The questions that move your bottom line.
Customer & product profitability
Net profit by customer, product, order, vendor, location and period, not just by business unit.
Cost-to-serve
Bring freight, handling, overhead and other drivers in to expose the true economics of every transaction.
Pricing intelligence
Spot pricing inconsistencies and test how discounts, order quantities and mix affect profit.
Profitability forecasting
Use historical patterns and operational assumptions to explore future revenue and profit outcomes.
Root-cause analysis
Move from a red KPI to the combinations of transactions and cost drivers that explain it.
What-if optimization
Model the potential impact of pricing, mix, procurement or freight actions before you commit.
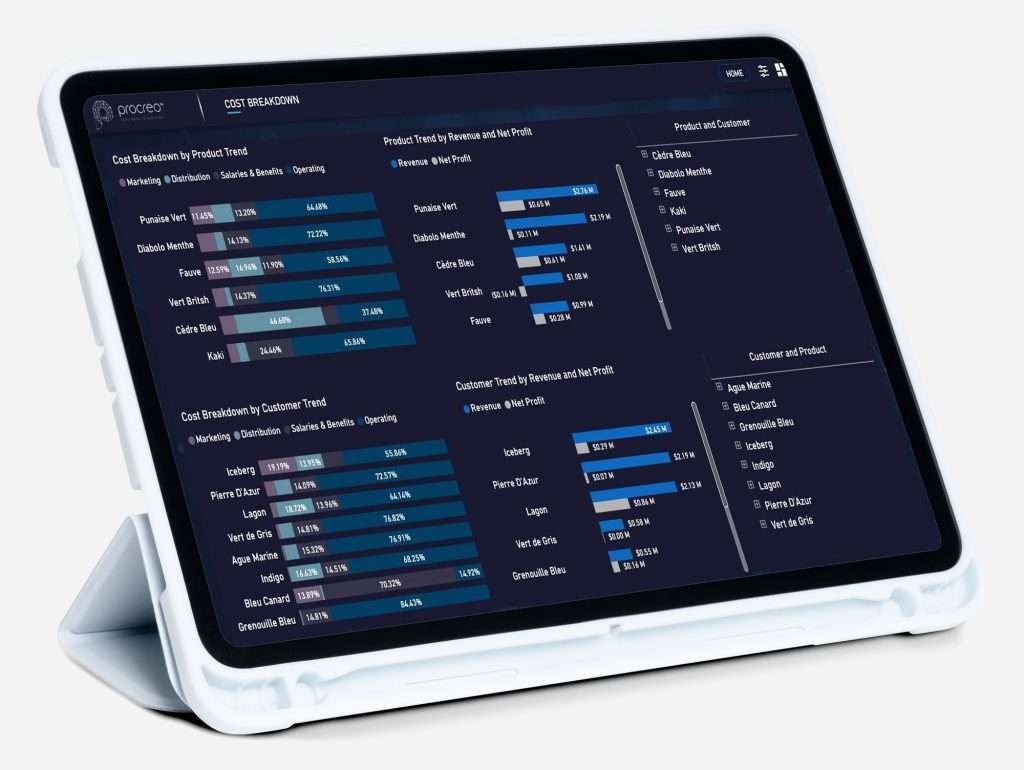
Not more dashboards. Financial truth, connected to decisions.
Bottom-line focus
Net profitability first, not revenue or gross margin alone.
Granularity
Trace every aggregate outcome back to its micro-entities and transactions.
Cross-functional
Connect finance with sales, purchasing, logistics and operations.
Cost allocation
Turn incomplete expense attribution into decision-useful economics.
Analysis to action
Go from detecting losses to testing practical optimization levers.
Works with your systems
An intelligence layer on top of your ERP and BI, not a replacement.
Built for the CFO. Useful across the business.
Profit leakage, made visible.
Better data, proper cost allocation and granular analysis surface what aggregate reports hide.
Medical equipment distributor
Orders under $10k were loss-making, and 55% of products lost money once freight and G&A were allocated by SKU.
Read the case →Fashion distribution group
The highest-revenue store wasn’t the most profitable, and 12% of manufacturers generated 100.4% of profit.
Read the case →Distribution group
A 12-lever scenario moved modelled net margin from −7.4% to +2.1% over a three-month pilot.
Read the case →